

A headline is a screenshot. Go find the movie.
One day, one quarter, one clip: how a true fact gets cut out of a longer story and sold as the whole thing, and how to put it back.
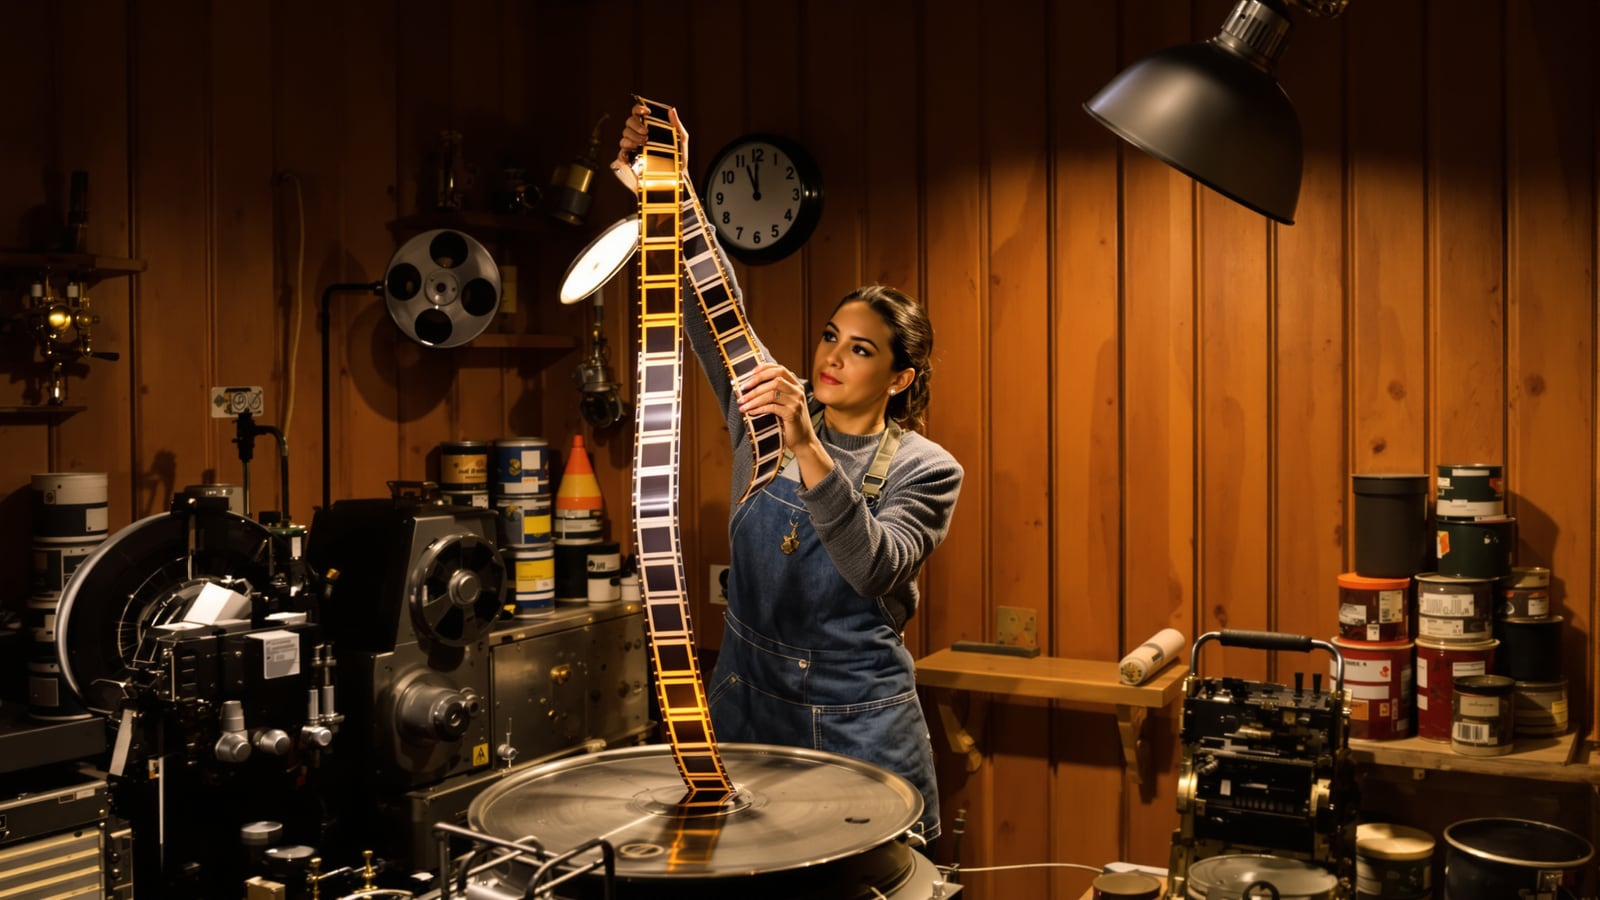
Quick answer: When a headline hangs on one number, one day or one clip, ask four things. Where does the timeline start? Compared to what? In what unit? What happened next? Two minutes of answers will tell you if you're looking at news or just a screenshot.
On June 14, 2022, the national average price of gas, as tracked by AAA, crossed five dollars a gallon for the first time. Every outlet ran it, and every one of them was telling the truth.
By winter the average was back around three dollars and change. Down by more than a third. Some outlets covered that too, a bit more quietly.
Neither headline lied. Both were one frame from a long film, and the frame you saw depended on which outlet you opened.
Why the single frame works
A timeline is boring. "Prices rose for sixteen months, then fell for six, and are still above where they started" is accurate, and nobody shares it.
A moment is vivid. It has a date, a number, and usually a villain. Editors know it, and so does anyone who wants your anger, your vote or your click. The cherry-pick rarely needs a false fact. It only needs a true one, picked from the right spot.
And it cuts both ways. People on the right and on the left each get handed their own favorite frame, and each side is quick to spot the other's. Spotting your own side's is the skill.
Question one: where does the clip start?
Start dates do quiet work. A chart that begins at a low point makes any later number look like a climb. A chart that begins at a peak makes the same number look like a collapse.
Take a headline I'm making up to show the shape: "Unemployment up for third straight month." Maybe that's the whole story. Maybe it's three months of small moves after two years of decline. The headline can't tell you, so go find the longer chart. The Bureau of Labor Statistics, the Census Bureau and the Federal Reserve all publish theirs free.
Slide the start date back five years, then ten. If the story survives, it's real. If it flips, you've learned what the headline was hiding.
Question two: compared to what?
"Record" is the favorite word of the cherry-pick, so test it. Record since when? Record in what kind of dollars?
That five-dollar gas price was a record in plain dollars. Adjusted for inflation, analysts generally rank the summer of 2008 higher. "Record" was true and also incomplete, which is the usual condition of a record.
The comparison point matters just as much. "Up 12 percent from last year" means little if last year was a freak. Look for the number before the freak year too.
Question three: what's the unit?
Same event, different ruler, different feeling.
On March 16, 2020, the Dow Jones Industrial Average fell almost 3,000 points, the biggest one-day drop in points the index had ever seen. In percentage terms it was about 13 percent, which was awful. But on Black Monday in 1987 the Dow fell about 508 points. That sounds tiny beside 3,000. In percentage terms it was about 22 percent, a far worse day.
Points make recent days look worse because the index is so much higher now. If a story gives you a raw number, a dollar amount or a head count with no rate, ask what it looks like per person, per year or per hundred. A city of three million will always have bigger raw numbers than a town of thirty thousand.
Question four: what happened next?
This is the one headlines can't answer, because they're written the same day. A scandal looks different once the facts come in. So does a spike. So does a "crisis" that turns out to be a bad Tuesday.
Search the story's key term and look at dates after the one you're reading. Did the number hold, reverse or get revised? Government figures are often revised weeks later, and the revision rarely gets the headline the first estimate did. Outlets differ in how openly they correct themselves. How to Tell Which Outlets Actually Own Their Mistakes covers how to check that.
The quote version
The same trick works on words. A clip of eleven seconds from a forty-minute speech is a frame, too.
Find the full video or transcript. Read the two sentences before the quoted line and the two after. Sometimes the clip is fair and the speaker said exactly what the headline claims. Sometimes the next sentence starts with "but" or "some people say." You won't know until you look, and looking takes about a minute.
Test it against your own side first. If a clip of a politician you can't stand makes you furious, check it. If a clip of one you like makes you feel vindicated, check it harder. The pull you feel is the signal.
When the moment really is the news
Don't swing too far. Skeptics who distrust every single data point are as easy to fool as believers, only in the other direction.
Some single moments are the story. A bridge collapse is one day, and no timeline makes it less of a collapse. A one-day market crash can matter even if the market recovers, because people lost jobs and savings in the meantime. A sudden break in a long trend can be the most important fact in the piece.
So the question isn't "is this one moment?" It's "does the moment mean what the headline says it means?" Sometimes the answer is yes. A sharp editor will tell you which kind of story it is, and the best ones say so in the second paragraph. The four questions an editor asks before a story runs is worth reading alongside this.
The two-minute routine
- Find the date range. If the article doesn't say, treat that as information.
- Pull the longer chart. Go to the source agency, not a screenshot of one. Move the start date back.
- Check the unit. Raw number or rate? Plain dollars or inflation-adjusted?
- Search for what came after. Look for dates later than the article's.
- Read around the quote. Get the full transcript and read the lines on either side.
Do it first on a headline you like. Then do it on one you don't.
Your feed will keep serving you frames, and it picks the vivid ones on purpose. How Your Feed Decides What You See, and How to Take It Back explains why. You can't stop that, but you can refuse to mistake a frame for the film.
Nobody's asking you to distrust everything. You're only being asked to check what happened before and after the picture was taken.
Marcus Vale
Editor-in-Chief
Twenty years in magazines, most of it deciding what to cut. Writes about work, discipline and the decisions that compound.

Watch
Worth an hour of your evening
More from Media Literacy.
From channels we rate. Plays on YouTube.
Read next